In lucky ep 13, the Ladies try to trade for Brent Seabrook, talk the Stanley Cup Final, create an app for psychopaths, go over some of the proposed changes for next season, and do all the hockey fancasting our listeners could ever want.
You can also find us on iTunes! If you have a second, please rate & review!
The ginger-bearded brother of our stalwart captain can easily be considered the most maligned man in the Dallas Stars fandom right now. Click on any article about Dallas’s woes and you’ll see at least two or three people squawking about the need to glue his ass to the bench.
And for four games, Lindy Ruff did just that.
Did it work? Was that the magic cure for the team? After all, the Stars did win 3 out of those 4 games.
As I spoke about earlier this week, one of the best stats to use to compare a player to his competition is Corsi, a possession metric. Possession is equally as important for Defense as it is for Offense, because if you have the puck, the other team obviously doesn’t.
Y’all better appreciate this graph cuz Excel did not like it.
First things first – how to read this graph (all numbers through 12/12 & can be found at waronice.com):
Both the blue line (Jordie) and the red line (Dallas) are Overall Corsi, 5v5 in all score situations. Dallas is an overall team number (including Jordie).
The green line (Jordie) and the purple line (Trevor Daley) are Corsi Relative % 5v5, all score situations – basically a measure of how much they helped or hurt the team’s possession.
I have squared off the section of games where Jordie was sitting. Do you notice anything different? Yeah, me neither. The Stars’ best possession games were against Minnesota (5-4 OT Loss) and Arizona (3-1 victory), with an abysmal showing against LA (5-4, victory).
It’s pretty easy to see why he was benched, though. He’s had a string of bad possession numbers, starting on 10/28 all the way through the 11/16 Chicago drubbing. Since his return, though, he has been a better than average puck-possessor for the Stars. In fact, he & Jason Demers have posted the best CR% for any d-pairing that Ruff has put together thus far. It’s a small set of data (only three games), but I expect to see this pairing an awful lot going forward.
Why did I put Daley’s CR% on this graph? Well, if people are going to single out Jordie Benn for poor possession, it’s only fair to see what one of our highest paid defenseman is doing for us. And frankly, it’s not much. Daley was all over the place at the start of the season – in fact his Corsi is sitting at a lifeless 44.2%. Jordie’s is 51.75%.
It’s encouraging to see Daley start to level out, as the wild swings mean inconsistency in game, which is never something you want to see from your top Dman.
As has been pointed out several times – you’re less likely to possess the puck if you’re starting in the defensive zone! Remember, this graph is 5v5, so Daley’s considerable time on the PK isn’t being held against him. That said, Jordie Benn’s Offensive Zone Start % is -6.39%, which is lowest of all seven dmen.
Jordie Benn starts in his own zone more than any other Dallas D man and still has a better Corsi than Trevor Daley (or Goligoski, for that matter, though he’s not charted), and yet he’s the number one problem?
Of course he is, Carolyn! Did you not see that turnover?
This is my favorite graph. I want to hug it.
Now as labeled, this graph measures give aways, as captured at hockey-reference.com. While there is some (read: a lot) of subjectivity in what constitutes a giveaway, and how a giveaway differs from a turnover, I’ve tried eliminate most bias by keeping the data source constant.
Now there are three separate statistics being measured on this graph. Everything is a rate, as this eliminates the issue of different amounts of games our defense has played.
The first two lines to study are the Blue (Giveaways Per Game), and the Red (the same measure with the total Dallas numbers). On average, the Dallas Stars defense has 0.712 giveaways per game. Jordie Benn, 0.708. Yep. He’s average when compared to the rest of the team. Those big spikes? That’s Goligoski at 1.00 and Klingberg at 0.96.
I’m not saying this is good for Jordie. It is, objectively, pretty terrible. The Minnesota Wild’s D-core are posting an average of 0.444 giveaways per game. Out of their eight defensemen, only one is posting an “above the Dallas Stars” average – Matthew Dumba at 0.75.
But pointing fingers at Jordie for turnovers is ignoring the larger problem of being a giveaway prone defense. Maybe it’s more tolerated from a rookie like Klingberg, but when Goligoski is making 4.6 million a year, a giveaway per game isn’t acceptable.
But Carolyn, his turnovers are what are killing us in tight games!
Are they really though? If you check the second box, the green line (5v5 Close Giveaway %) and purple line(total Dallas percent) examines that. The 5v5 Close literally means “in situations where the score is +/- 1 goal”. The Stars’ total percent of giveaways in close situations is 40.4%. Jordie Benn is right on average at 41.2%. While Jokipakka is the largest outlier with 4 out of 4 giveaways during close game situations, Daley’s spike is the most concerning.
64% of Daley’s giveaways come during close score situations. In raw numbers, that’s 9 out of 14. Again, it’s one thing to see a rookie lose his composure in tense games, but can you really excuse that behavior from Daley, who wears the A?
Well, you argue, Daley is our top defenseman, he’s going to play more when the games are close! Of course he’s going to have more turnovers then compared to everyone else!
Ehhhh that doesn’t really pan out. When you look at the bottom of the graph, everyone’s giveaways per minute played during close situations are relatively flat, with Jokipakka being the notable exception.
So yes, while turnovers are killing the Dallas Stars Defense, pinning all the blame on Jordie Benn, who makes $700,000 a year is misleading. He definitely can, and should, be asked to get better by the coaching staff, but there are far bigger turnover problems than the elder Benn.
That’s not to say that there aren’t problems with Jordie’s play. He’s taken 7 penalties (the most of any dman), but he has only had 2 in the last 5 games (same as Klingberg, and Demers has had 3, not to mention our forwards). He’s right up there with Goligoski in blocked shots (1.38/game and 1.39/game respectively), but the other large part of being on defense is positioning.
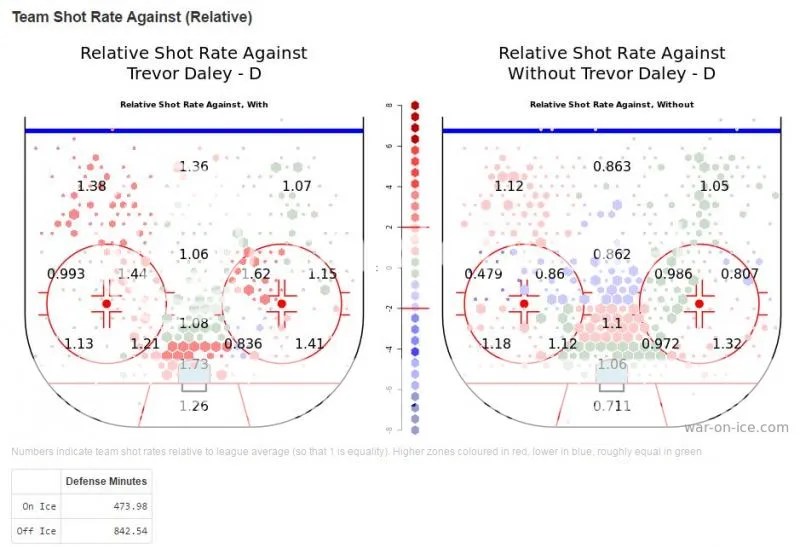
This graph is a little bit difficult to interpret, but basically, there are three areas of the ice that skaters shoot from: the outer most zone, a middle range, and then right by the crease. The more ‘red’ the area is, the more other teams are taking shots against Dallas there, relative to league average. Green is neutral, and blue is better. On the left you have shots against with Jordie on the ice, and on the right, without him on ice.
The first thing that jumps out is how much more red the graph on the right is compared to the left. This is bad news for Jordie Benn dectractors; without Jordie, there are 5% more shots on net directly in front of the crease and a whopping 20% increase on the wing.
What this tells us is that he’s being particularly effective on the perimeter at preventing shots. However, he does leave some work desired in protecting the goalie from all of those centers who love to crash the net. This is a huge area of opportunity for him, especially because it’s a giant weakness for the Stars overall.
The Graph on the Left speaks to Dallas offense, so we’re only really interested in the one on the right. That 1.3 right on top of the net? That means the Dallas Stars are letting teams get off 30% more shots right in front of the net than average. 30% more!
Jordie certainly can help with that – he’s still 14% above league average in that zone, but he’s not the worst offender on the Stars Defense. Unfortunately, that title goes to…
Notice how the colors are flipped on that graph vs Jordie’s graph? Yeah, that’s bad. And for 3.3 million a year, that’s really, really bad.
Here’s my grain of salt before everyone clamors to trade Daley: Daley, as a top Dman is going to be defending first line offense more than Jordie. Also these Hextallys (found at waronice.com) represent season wide stats which don’t show short-term trends, and as the Corsi chart shows, he has had a rough start to the season, but is trending upwards in possession.
Why do you keep mentioning salary, Carolyn? That has nothing to do with possession!
You’re right, to an extent. However, to say that salary isn’t commensurate with level of play is ridiculous (Kane & Toews anyone? Bueller?). So the crux of the matter is that Jordie Benn is being paid less than any other Dman the Stars have right now.
Yes, all of them, even the rookies, are making more money.
Per capgeek.com, there are 12 other defensemen in the league making $700k. That’s it, twelve. And here I’ve written about 1700 words comparing him to the other Stars Dmen, when really there are only 12 people in the league in the same situation.
Oh wait…if I take out anyone who has played less than 5 games in the NHL this season, I’m left with this:
That’s five guys making making the same money. Jordie has played the most games, and has a higher Corsi than all but one of them. Say what you want about Jordie’s play, but I guarantee you Jim Nill is happy with that ROI.
It feels like Stars fans are falling under the influence of the old Availability Heuristic, “A mental shortcut that occurs when people make judgments about the probability of events by the ease with which examples come to mind.” Jordie Benn makes one turnover – Jordie makes the most turnovers. Jordie is out of position – Jordie isn’t blocking shots. We lose a game – Jordie lost us the game.
When things don’t go my way, I turn to data to find out why. That doesn’t work for everyone (nor should it, god, how much time did I spend on this?), and that’s fine. But you have to remember – this is a team sport. One player isn’t going to be the reason the Stars lose…or win…anything.